We make your data accessible, and easy to understand. Are you interested? Please contact us.
Dashboards: your quick overview
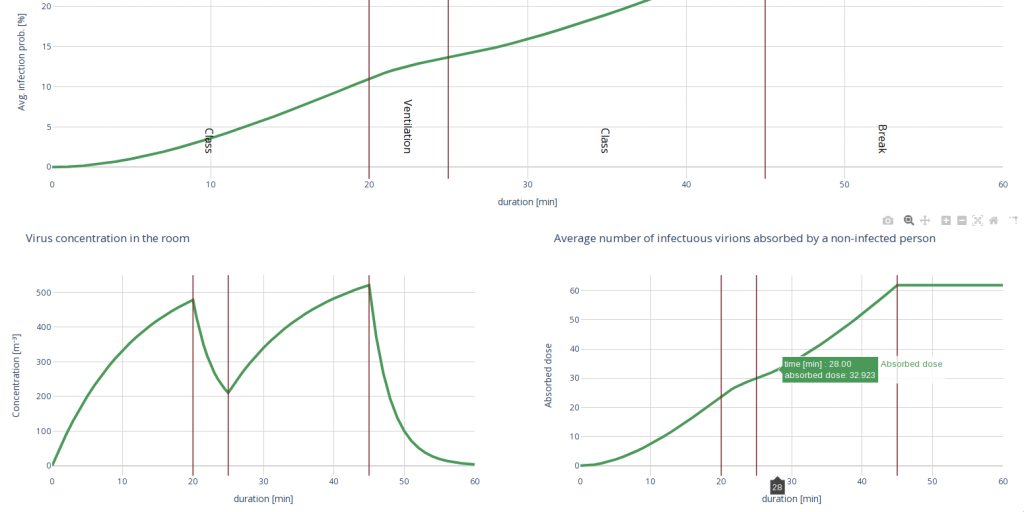
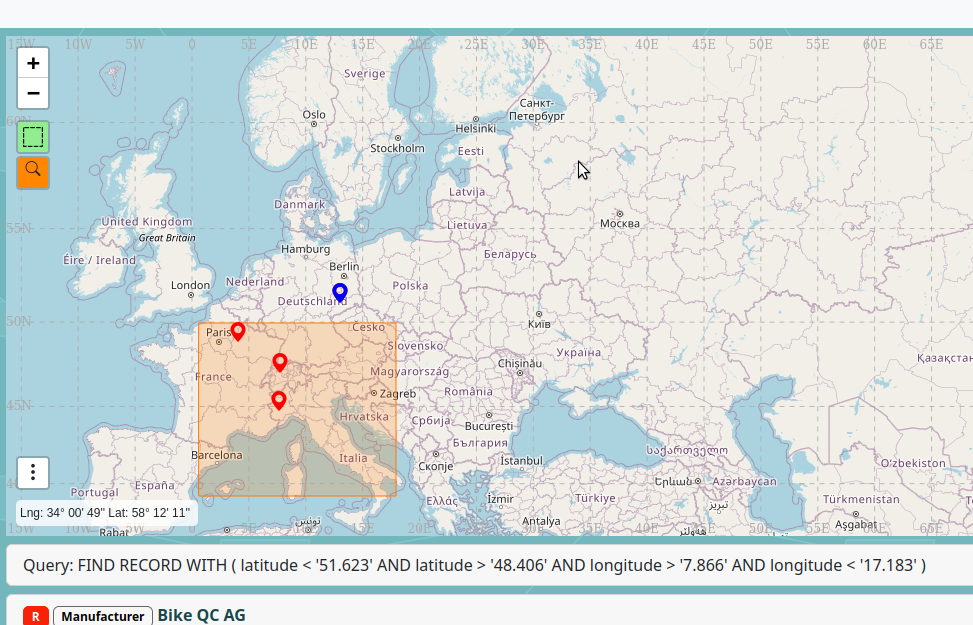
When you need a brief glance, one graph often says more than many tables, and specialized data views can help you stay focused on the essentials.
If you need an overview of the most important key figures for your daily work, must stay informed about new unexpected events, or simply don’t have the time to assess all the raw data, we recommend a customized dashboard view based on LinkAhead. This will display the most important data, aggregated information and statistics, and alerts on specific events if needed. We put together a dashboard for you that brings together all the information at a glance.
Also, if a fixed workflow should be defined for samples or workpieces, so that the next processing steps show up, we can easily integrate this functionality into a dashboard.
By the way: from the dashboard, you can jump to the associated raw data if you wish and thus at any time have the full flexibility of LinkAhead at your fingertips.
Your data on your website
Your website is your showcase on the web. If you want to publish data there, your visitors no longer have to go anywhere else. We would be happy to work out a concept with you on how a view of the data can best be integrated on your website, which data may be released and which interactions with it should be possible.